
Reading a pump curve correctly allows you to match a centrifugal pump to your piping system requirements in 30-45 minutes. This intermediate-level pump curve analysis ensures optimal pump operation, prevents cavitation, and maximizes energy efficient pumping by identifying the correct operating point where system resistance curve intersects the pump performance curve.
Before You Begin: Prerequisites for Pump Curve Reading
Contents
- 1 Before You Begin: Prerequisites for Pump Curve Reading
- 2 Understanding Pump Performance Curve Components
- 3 Step 1: Calculate Total Dynamic Head (TDH)
- 4 Step 2: Determine System Flow Rate Requirements
- 5 Step 3: Plot System Curve on Pump Chart
- 6 Step 4: Locate Operating Point Where Curves Intersect
- 7 Step 5: Verify Best Efficiency Point Proximity
- 8 Step 6: Check NPSH Requirements for Cavitation Prevention
- 9 Step 7: Confirm Horsepower and Motor Sizing
- 10 Troubleshooting Common Pump Curve Reading Issues
- 11 Next Steps After Pump Selection

Required Information:
- System design flow rate (GPM or cubic meters per hour)
- Static head (elevation change between suction and discharge)
- Pipe diameter, pipe length, and material specifications
- Complete list of fittings and valves in piping system
- Fluid properties (temperature, viscosity, specific gravity)
- Pump manufacturer performance curves from vendor catalog
Required Tools:
- Calculator for head loss calculations
- Friction loss charts (Hazen-Williams equation or Darcy-Weisbach equation)
- Graph paper or digital plotting software
- Manufacturer pump curve charts with efficiency lines
Understanding Pump Performance Curve Components
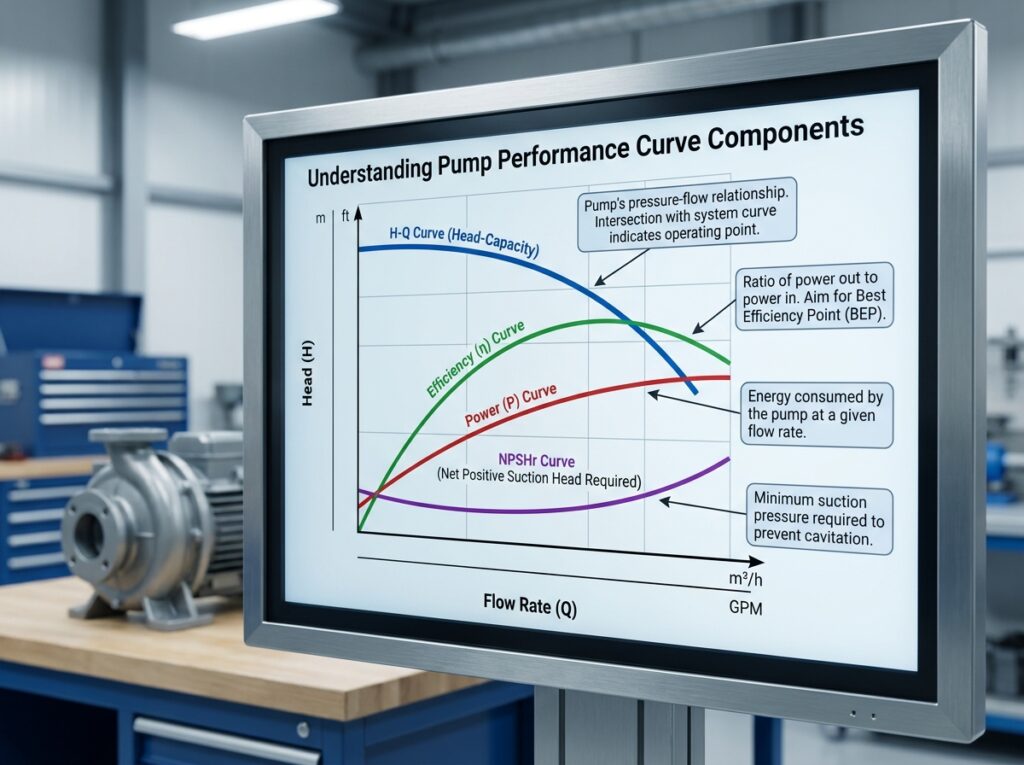
A pump curve chart displays the relationship between flow rate and total dynamic head developed by a centrifugal pump at constant pump speed (RPM). According to the Hydraulic Institute (2023), a complete pump performance graph includes five critical curves that guide pump selection criteria.
Essential Pump Curve Elements:
- Head-Capacity Curve (Q-H curve): Shows developed head at various flow rates
- Efficiency Curve: Indicates pump efficiency percentage across the pump operating envelope
- Brake Horsepower Curve (BHP): Displays motor horsepower requirements at different flows
- NPSH Required Curve: Shows net positive suction head needed to prevent cavitation
- Impeller Diameter Lines: Multiple curves for different impeller sizes
The X-axis represents flow rate (typically gallons per minute or cubic meters per hour), while the Y-axis displays total head (feet of head or meters of head). The best efficiency point (BEP) occurs where the pump achieves maximum efficiency, typically marked prominently on manufacturer pump curves.
Step 1: Calculate Total Dynamic Head (TDH)
Calculate your system’s total dynamic head by adding static head, friction loss, velocity head, and pressure head requirements. The formula is: TDH = Static Head + Friction Head Loss + Velocity Head + Pressure Head.
Static lift requirements equal the vertical elevation difference between suction and discharge points. Measure this distance in feet or meters. For a sump pump sizing application, static head represents the depth from the fluid surface to the discharge elevation.
Friction head loss depends on pipe friction factors, flow velocity, and system resistance. Use the Hazen-Williams equation for water applications or Darcy-Weisbach equation for other fluids. According to fluid dynamics principles (Engineering Toolbox, 2024), friction losses increase proportionally to flow rate squared.
Step 2: Determine System Flow Rate Requirements
Identify your pump capacity requirements based on system demand analysis. Consider maximum flow conditions, not just average flow rates. For water distribution systems, include peak demand periods. For industrial pump sizing applications, account for future capacity expansion.
Document both minimum and maximum flow requirements to ensure the pump operating characteristics accommodate the full range. Adequate flow rate determination prevents selecting an oversized or undersized pump that operates inefficiently outside the preferred operating range.
Step 3: Plot System Curve on Pump Chart
Develop your system curve by calculating required head at multiple flow rates. The system characteristic analysis creates a parabolic curve showing how system head requirements increase with flow due to friction losses.
System Curve Plotting Process:
- Calculate head at zero flow (static head only)
- Calculate head at design flow rate (static + friction losses)
- Calculate head at 150% design flow (verify maximum conditions)
- Plot these points on the same graph as the pump performance curve
- Draw a smooth parabolic curve through the points
This curve matching process reveals where your system resistance intersects with available pump curves, establishing the theoretical operating point. When reading a pump performance curve, this intersection determines actual pump performance in your specific application.
Step 4: Locate Operating Point Where Curves Intersect
Find the actual operating point where your system curve crosses the pump curve. This intersection represents the flow rate and developed head the pump will deliver when installed. The operating point determination is critical for pump performance prediction.
Compare this intersection to the pump’s best efficiency point. Optimal pump operation occurs when the operating point falls within 80-110% of BEP flow rate. Operating outside this range reduces pump efficiency and increases energy consumption, according to pump application engineering standards (ASHRAE, 2023).
For lift station design or booster pump selection, verify that the operating point provides adequate margin above minimum required head while staying within the pump operating envelope defined by minimum and maximum flow limits.
Step 5: Verify Best Efficiency Point Proximity
Examine the efficiency lines on the pump curve near your operating point. The pump efficiency optimization goal is selecting a pump where your operating point achieves 70-85% efficiency for most commercial applications.
The BEP represents the ideal duty point selection where the pump delivers maximum hydraulic performance with minimum energy consumption. Operating significantly left of BEP causes recirculation and vibration, while operating right of BEP increases impeller wear and may approach runout conditions.
If your operating point falls outside the preferred zone, consider these pump matching methodology adjustments:
- Select a different pump model with BEP closer to your requirements
- Adjust impeller diameter within the available range
- Consider parallel pump operation for high flow applications
- Evaluate variable frequency drive (VFD) application for varying demands
Step 6: Check NPSH Requirements for Cavitation Prevention
Verify that NPSH available (NPSHA) exceeds NPSH required (NPSHR) by at least 2-3 feet across the operating range. The NPSH curve on the pump chart shows net positive suction head requirements at various flow rates.
Calculate NPSHA using: NPSHA = Atmospheric Pressure + Static Suction Head – Suction Line Losses – Vapor Pressure. Inadequate NPSHA causes cavitation, resulting in noise, vibration, and pump wear analysis issues.
According to pump engineering standards (HI 9.6.1-2023), NPSHR increases with flow rate, so verify adequate margin at maximum anticipated flow conditions, not just rated flow conditions.
Step 7: Confirm Horsepower and Motor Sizing
Read the brake horsepower curve at your operating point to determine motor horsepower requirements. BHP represents the power consumed by the pump impeller and volute. Add 10-15% safety margin for motor sizing.
The power consumption curve shows how BHP varies with flow. For variable speed pumping applications, the affinity law application reveals that power consumption varies with the cube of speed ratio, allowing significant energy savings using pump curves and VFD technology.
Verify that selected motor horsepower exceeds maximum BHP across the entire operating range to prevent motor overload, particularly important for sewage pump selection and slurry pump curves where fluid properties may vary.
Troubleshooting Common Pump Curve Reading Issues
If operating point falls far left of BEP: Pump is oversized. Consider trimming impeller diameter, installing a smaller pump, or using VFD to reduce pump speed. This prevents low-flow recirculation and excessive energy consumption.
If operating point falls far right of BEP: Pump is undersized. Select larger pump model, consider series pump configuration for additional head, or verify system curve calculations for errors in head loss calculations.
If NPSHA is insufficient: Increase suction line diameter to reduce suction pressure losses, lower pump installation elevation, or select pump with lower NPSHR curve characteristics.
If multiple pumps create confusion: For parallel pump installation, plot composite curves by adding flow rates at constant head. For series pump configuration, add heads at constant flow rate to create combined pump performance characteristics.
If curves don’t match fluid type: For non-water applications or viscosity corrections, multiply flow and head by correction factors from Hydraulic Institute viscosity charts. Chemical pump sizing requires adjustment for specific gravity and temperature effects.
Next Steps After Pump Selection
After completing pump curve interpretation, document your pump selection with calculated operating point coordinates, efficiency, and horsepower. Request manufacturer performance curve verification for your specific duty point.
Consider commissioning procedures and acceptance testing to verify field pump performance against curve predictions. Measure actual flow and head during pump performance testing to confirm proper pump hydraulics and identify any installation issues.
For systems requiring replacement components, explore common lift station replacement parts to maintain optimal performance over the pump’s service life.
Implement monitoring systems to track operating point shifts that indicate pump wear analysis needs, system changes, or performance degradation requiring maintenance or pump troubleshooting interventions.